The cup with handle pattern is one of the most bullish chart patterns. It works well on top growth stocks during a market uptrend. Its a close cousin to the rounding bottom pattern – another very bullish pattern.
As the name suggests, this chart pattern looks like a cup or pan with a handle. Imagine looking at a pan (with the handle projecting to your right) from the side of the pan and you will see it easily on the chart below.
They can be found on all time frames but they are most bullish when found on a weekly chart on a top growth stock during a bull market. They tend to fail more often than not during a correction, bear market or after a bearish market signal.
So you need to make sure the market or at least the industry is trending higher into the pattern. In other words, making higher highs and higher lows for a number of months.
If you look at all the great growth stocks in history, you will see that they nearly all break out of this pattern, a flat base or a bull flag pattern early in their epic run. Most break out of the cup with handle. And generate this pattern at various points during their long trek higher.
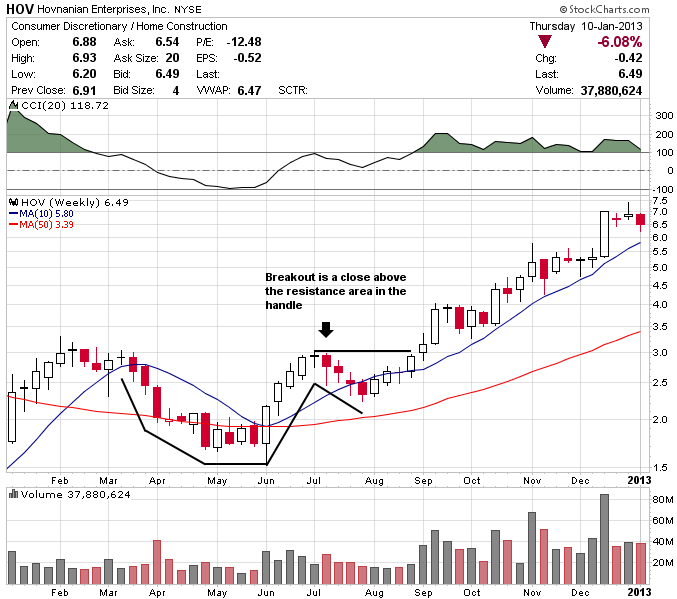
Here is a pretty text book example of a cup with handle pattern:

Cup with handle pattern
Most do not have this perfect of a shape. This is a continuation pattern and we need to see an uptrend leading into the pattern.
Notice how there are more volume spikes during the up weeks versus the down weeks. More high volume down weeks than high volume up weeks is a bad sign.
The consolidation on the right side of the pattern is the handle. The top of the handle consolidation area needs to be below the top of the left side of the base and the midpoint of the handle should be in the top half of the overall pattern. Very important nuances to be aware of.
We want to see the handle trend slightly lower, or at least sideways, over time with volume trailing off. A handle that trends higher indicates that the pattern is faulty and prone to failure.
Some traders like to enter once the short-term downtrend has broken in the handle. The other entry point is a break above the top of the handle portion of the pattern.
We did a study over a 2 year period and found that its better to wait until the price closes above the handle in the pattern. This is because many stocks will never make it above the handle. Especially if the fundamental factors or market trend are less than ideal. We only trade this pattern on the very best growth stocks with at least a couple years of proven very strong sales and earnings growth.
Ideally, we want to see 2 times the average volume or more on the breakout.
We generally put a stop 5% to 10% below the entry point. Ideally, a point just below the bottom of the handle. But never more than 10% below the entry point.
Its a momentum trade on a growth stock so you need a hard stop.
A good target is generally 20% to 25% above the handle. We keep a portion of our shares if it makes a 20% move higher within 3 weeks. As long as fundamental factors support a stronger move – these factors are normally accelerating earnings and sales growth.
Again, this pattern does not work during a correction or after a bearish market signal until another bullish market signal. Its also challenging during periods where the VIX is above 20 to 25. Other stocks in the same industry should be in strong long-term uptrends as well.
The pattern is most bullish on a weekly chart although we trade them on a daily chart as well if the stock is in a very strong uptrend.
We also find it to be a fairly reliable pattern for day trading if the volume is at least 2 to 3 times the near-term average on the breakout in the first hour and a half of trading where you put your stop below the handle. They can also work later in the day on micro cap stocks if the stock is already up 30% or more that day and is highly active versus the size of the float.
These patterns are much more common than a bull flag pattern (note the distinction between bullish flag and bull flag – bullish flags are common while bull flags, or high tight flags, are pretty rare in most markets).
You need to have enough trading setups in your arsenal, so its important to have this more common pattern on your radar and know how to trade it if you are trading quality growth stocks.
Subscribe to our Youtube channel and get more free expert insight!
Our 2 Top Trading Setups with Bullish Chart Patterns AND Fundamentals Poised to Move This Week


