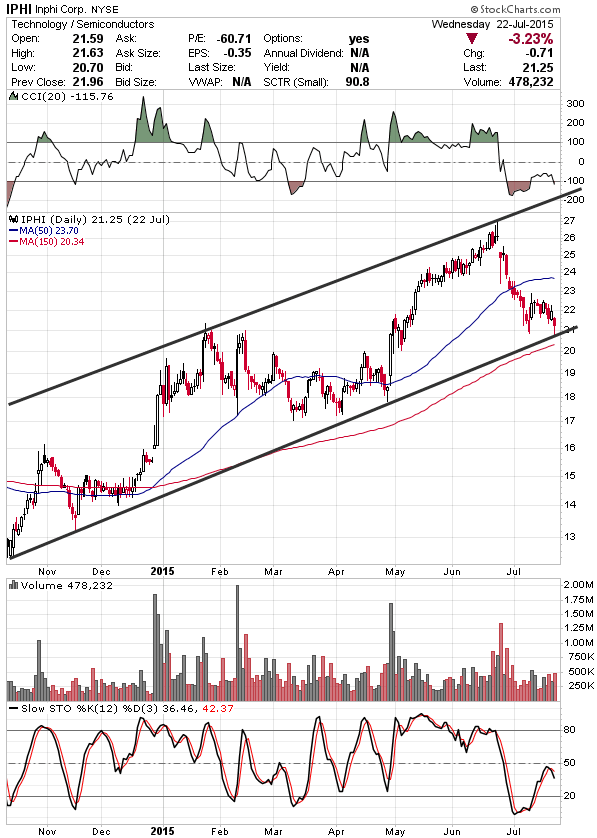
Channeling stocks are stocks that have a strong tendency to trade between a support and resistance. The distance between the support and resistance makes the stock appealing to channeling stock traders.
The difference between support and resistance typically needs to be at least 10% to 15%. Preferrably, 20% or more.
Generally the support and resistance are fairly fixed price points. However, an even better type of channeling stock is one where the channel slopes upward.
Very few stocks are trading in a wide enough channel to be of interest at any given time. Other stocks just do not have a reliable enough support that has been tested at least 3 times.
Ideally, you want to see the channel support tested 5 or more times but a minimum of at least 3 piques our interest. You can always draw a line between any 2 points on a chart. Again, we avoid calling it a valid channel until support has been tested 3 times.
What is unique about our approach is that we only trade stocks that have fundamental factors that are improving to justify a higher price after the point of entry. These factors include high, sustained sales and earnings growth for a number of years along with other key factors. Or a strong track record of beating estimates with rising future expectations.
Below is an example of a channeling stock featured in our newsletter in 2015:

A Channeling stock featured to customers with 25% to 40% profit potential within a few weeks.
Our entry point is a close above the short-term downtrend resistance. Created by drawing a line connecting the highs during the pullback. This line should closely reflect the slope of the short-term downtrend back to the support.
Another entry point could be a strongly bullish candlestick pattern near the support. You want to see strong signs that the stock is about to swing higher.
Generally, you hold the stock for a number of days to weeks and sell with a limit order near but below the resistance. This can easily take a few weeks in many cases. In other cases, it happens within a few days.
We generally wait until the price closes below the uptrend support before exiting the trade early.
Now here is the most important difference with our channeling stock strategy versus the others. We focus on upward sloping channels because with an upward sloping channel, a later drop below the channel often occurs above your entry.
So, if you are stopped out below the support, its often for a profit instead of a loss. With a horizontal channel, you will always be stopped out for a loss.
So we spend our time scouring the market for upward sloping channels. These stocks generally have the best fundamental factors as well. We do not use a hard stop-loss because we find stocks with rising estimates tend to bounce back before the end of the trading day.
But we definitely cut losses (or small gains) when the price closes below the uptrend support. Because the fundamentals are rapidly improving, you often get a gap higher the next day. However, you can also place a stop just below the support and raise it over time.
Another great example of this type of chart pattern is on our home page.
As always, you want to put a limit order for your target sell price. We have seen so many times where the price reaches the target during the day only to sell off quickly within a couple days. So putting in a limit order is critical with most trades and your long-term success.
This upward sloping channeling stock pattern is just one of the many we look for in our own trading and newsletter. But only on stocks with rapidly improving fundamentals to support a higher price.
Subscribe to our Youtube channel and get our free expert instructional videos on chart patterns when released!


