We have 2 basic types of long setups in the Weekly and Daily Alert alerts: our classic swing trading or channeling stock setup as well as momentum trades. This page covers our momentum plays.
With both types of trades, you want to see the fundamentals of the company improving rapidly. With momentum plays, we look for stocks with strong and sustained earnings and sales growth. Ideally, with recent growth acceleration. Along with other key fundamental factors discussed in our swing trading book.
With a momentum trade on a high-flying growth stock, you want the underlying growth of the company to keep pace with the share price gains. Or, at least moving strongly in the same direction.
Typically, these ideal momentum setups are in long-term up-trends and are just completing or have just completed a bullish chart pattern (sometimes referred to as a consolidation pattern).
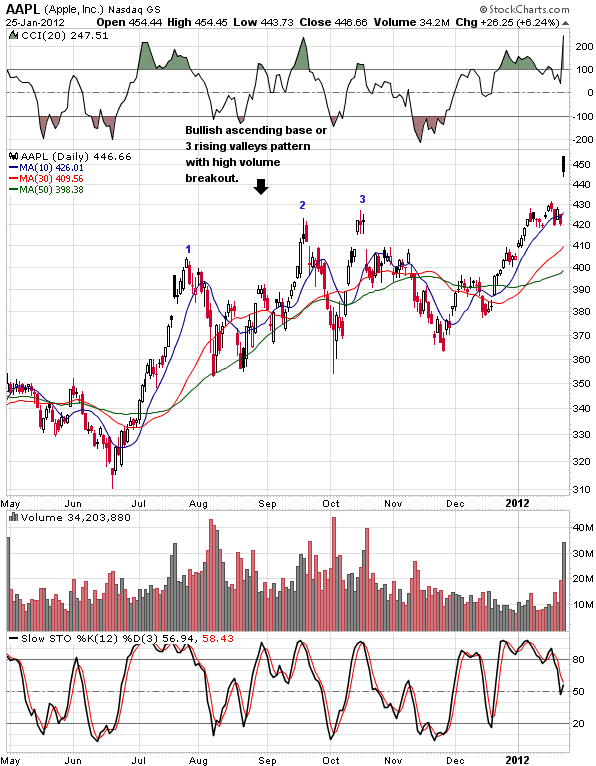
Usually either a cup with handle pattern, rounding bottom, flat base, high tight flag, double bottom or ascending base pattern. Below is an example of an ascending base pattern:
Apple was in an ascending base pattern back in January of 2012. One of our favorite bullish chart patterns on a top growth stock that often leads to big gains. In this case, the stock had already reached an ideal technical entry point by closing above the third successive high in the pattern.
So in the alert we said that the target entry was tomorrow morning. So you would just place a market order before the next trading session starts.
You can do this in the evening, in the dead of night or early the next day. Whatever fits your schedule best.

The big difference between swing trading and momentum plays is that we would put in a stop-loss order soon after entering the trade with a momentum play on a top growth stock like this. In this case the stop-loss was $418 as stated in the alert at the time.
As we have discussed in the alerts over the years, once the price has risen about 4% to 8% above the technical entry point, we generally sell a portion and stop the remainder at our entry point. Selling maybe 25% if it gets off to a strong start or 50% or more if it gets off to a weak start.
We do this because, most often, the biggest winners do not go back below the entry point after the initial breakout in a market uptrend. We like to use a “mental stop” and have our online broker message us if the price comes back to the entry point and then decide whether to give it a little more room. Or you can use a hard stop-loss order with your limit order (using an OCO or one cancels the other order) for your target sell price if you are at work or simplify the trade.
You would also put in a limit order for our target sell price which was $518. (This is a OCO order – one cancels the other order that most online brokers can handle.) We said the price could go much higher than that out of this pattern so you could have sold say 60% of your position at the first target and let the other portion ride higher while stopping the remainder at your entry point.
For the remainder of the position after hitting the price target listed in the alert, we like to sell once the price closes below the 20 EMA (exponential moving average) or 50 EMA followed by a move a few cents below the prior days low. So, we wait for the price to close below one of those key moving averages and then place a stop a few cents below the prior days low. Sometimes it will rebound strongly after closing below the moving average.
Now here is an example from the alert where the price has not reached its target entry point. This was a bullish cup with handle chart pattern on a top growth stock. Here’s how the chart looked when we featured it:

As we stated in our Daily Alert alert, the target entry is once the price closes above the short-term downtrend resistance. On the subscription site, you can simply click the chart to see the latest chart with this trend-line already drawn for you.
On the subscription site, you can simply click the chart to see the latest chart with this trend-line already drawn for you.
With a quick glance each day you can tell when the stock has reached its entry point. Once the price closes above that line, we would put a market order to purchase the next day – assuming the risk reward ratio is still acceptable. If the market has been more volatile, we often buy once the price has moved above the prior days high.
Sometimes the alert will even state the entry point is a “move above” a certain price for more confirmation that the price is breaking out. Preferably, we would have our online broker alert us at that price and enter the trade just above it. Again, you can easily put a buy-stop order after hours so the trade will not interfere with work.
For those who are not familiar with candlestick charts, you can check out our overview of our swing trading setups which has a quick and easy primer on candlestick charting. A very powerful type of chart that makes chart analysis easier.
To increase the win rate we only enter those trades that have a new news catalyst or market catalyst that day or night before. Refer to ‘how to play our swing trading picks’ for more details on catalysts.
Also, be sure to read some of our important trading rules before trading the stocks in our alerts. These rules have served us well over the years.


