We have 2 basic types of long setups in the Weekly and Daily Alerts: our classic swing trading or channeling stock setup as well as momentum trades. This page covers our classic swing trading setups within a long-term uptrend channel.
One of the great aspects of our swing trading system is that its designed for those who work for a living. You do not need to jeopardize your day job to use our proven swing trading strategies in both up and down markets.
You simply wait for a stock to reach our ideal technical entry point, place a market or buy/limit order in the comfort of your home anytime after 4pm and then place a limit order for the target price sometime the next day after entering the swing trade.
Then you just check for any sell signals after work each day and then change the limit order to a market order if any sell signals have emerged. If you subscribe to our alerts, we do all the hard work finding ideal trading setups with the right technical AND fundamental factors.
We find great swing trading setups WITHOUT relying heavily on risky stocks under $10. This tends to greatly reduce downside risk.
With our swing trading setups, you will generally see 2 lines with each stock featured in the Weekly and Daily Alert. One is the short-term downtrend resistance and the other is the uptrend support level or horizontal support if the stock is in a horizontal trading range (classic channeling stock).
The entry/buy signal for our system is a close above the stock’s short-term downtrend (downtrend resistance line). You can also enter the trade once it moves above the high made on the day it closed above the short-term downtrend resistance. This tends to increase success rates while giving up a little upside potential.
Its important to realize that many stocks will continue to trend lower within the short-term downtrend channel and go below the uptrend support. This is why we wait until the stock breaks out of the downtrend channel by going above the short-term downtrend resistance line without closing below the long-term uptrend support.
Another good technical entry point is once the price breaks the short-term downtrend resistance during the day and also above the prior swing high on a 1 hour chart. We definitely want to see a strong catalyst for the company or overall market for this more aggressive entry.
Another good entry is after the first pullback after breaking out of the short-term downtrend channel if it does not close below the long-term uptrend support line first. We wait for the next swing low to form and wait until the price closes above the prior days high and then enter if it moves above that days high the next day if the risk/reward ratio still makes sense.
Those stocks that are breaking out violently we may play with a tight 4% stop if the risk/reward is otherwise unfavorable at that point.
To improve our success rate, we look for a new news catalyst for the company when it reaches the entry point. This can easily be spotted on Yahoo news (a link is provided on the subscription site or you can use your online broker news feed for the company). Or, an upcoming event that could be positive for the stock within the next few weeks. If an upcoming event is an earnings release, we generally wait until after a strong report to enter a trade. Either way, the price needs to reach the entry point for price direction confirmation.
The stocks featured in the alert service already have a broad catalyst. This is generally very strong and consistent growth in sales and/or earnings. Or, recent earnings beats with rising future estimates.
Focusing on just top growth stocks and UPOD stocks gives us an edge and differentiates this service from other services online.
The best opportunities are top growth stocks with a strong track record of beating estimates with rising future earnings expectations.
Another good catalyst is a strong market or industry catalyst where the market or industry is up about 1% or more that day and trending higher. This tends to improve success rates also in our experience.
Sometimes the stock has already broken its short-term downtrend when its featured in the Weekly or Daily Alert. Using our system, we would buy at the open the following trading day as stated in the alert or once it moves above a key resistance as stated in the alert.
Again, we want to see a catalyst or upcoming catalyst that day for a higher win rate. As stated above, we also sometimes enter once it moves above the prior days high for more confirmation that the trend is now higher on all time-frames.
In the case where the downtrend has not been broken with a closing price, you would wait for this to occur (also stated in the alert underneath the chart in the alerts on the subscription site).
Subscribers can simply click the chart within the alert to see when this occurs. When you click the chart, the latest chart comes up with the downtrend resistance line already drawn for you. You can see when the price closes above the downtrend with just a quick glance each day.
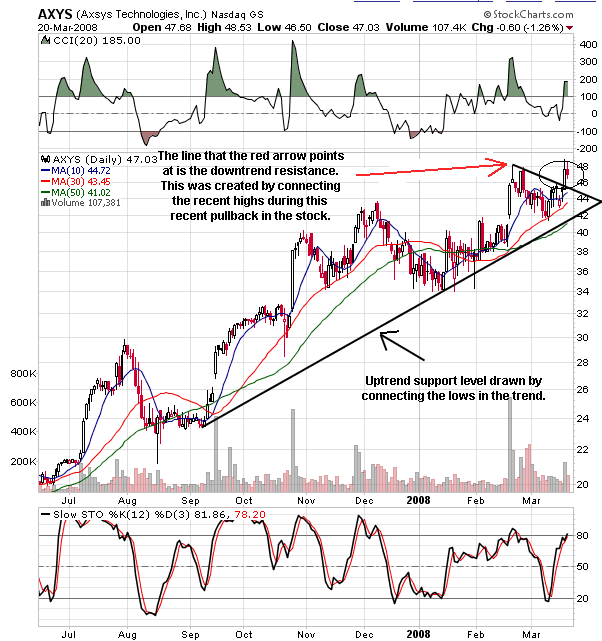
Here is a good example that illustrates when the target entry signal has been reached:

The chart above graphs the stock price through Mar. 20th of 2008. The trading day prior to March 20th, the stock closes strongly above the downtrend resistance line as circled on the chart. (On the subscription site, you can see an updated chart each day by clicking on the chart on the members site. The latest chart comes up with the trend-lines already drawn.)
Using our swing trading system, we would simply place a market order sometime between 4pm on the 19th and 9:30am the next day. Whenever its convenient with plenty of time to analyze the trading setup and company.
Again, for a higher win rate, we look for a company, industry or market catalyst that day or evening before. The order would then fill at the opening price on March 20th.
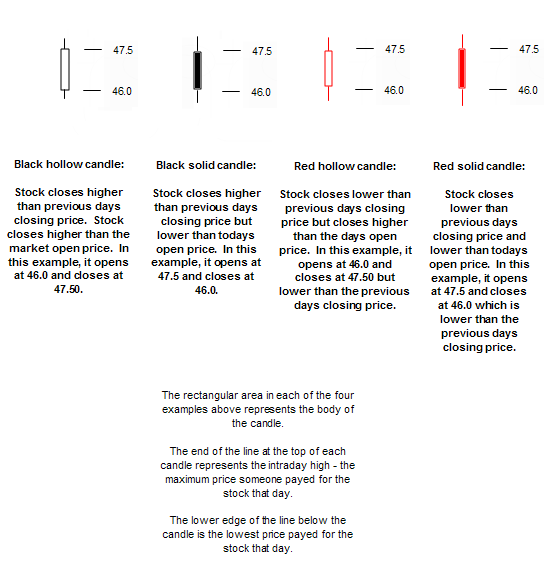
For those unfamiliar with candlestick charts, an example of each type of candle is shown below. Candlestick charts are awesome.
The colors, candlestick body and the top/bottom lines quickly communicate the action of the stock that day. Each type of candle is explained below. Its quite simple to learn:

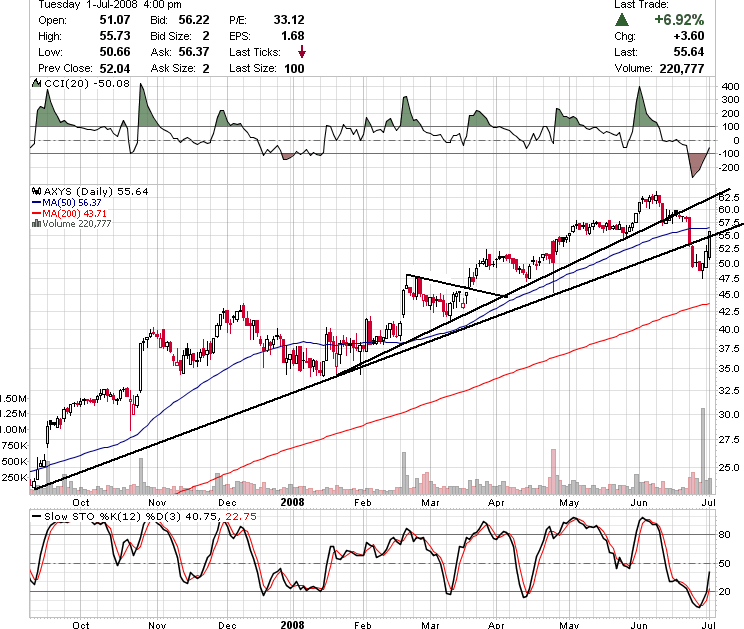
Once we enter a trade, the system calls for entering a limit order for our target sell price. In this case, our target sell price was $51.90 which was reached just a few days later. Entering the limit order for a good portion of your position is critical to swing trading success over the long-term.
If the entry point is a “move above” a certain price for more confirmation that the trend is changing back to the upside, you would put a buy-stop order a penny or so above the price listed. Or, preferably, put in a text alert with your online broker just above that price and enter the trade from your smartphone. Unfortunately, we have seen cases where a “quote” triggers a buy-stop order rather than an actual trade.
Another big advantage of our swing trading strategy is that you can either play the first wave higher out of the consolidation. Or, go for the final target in a longer-term swing trade.
The first wave higher might be 4% to 20% or more with the stocks we feature within several days.
In either case, we generally take some profits in the 4% to 10% range and then use a mental stop around the technical entry point or just below the next horizontal support level beneath it.
In general, we sell about 25% if it gets off to a strong start or 50% or more if it gets off to a weak start or if its a volatile market. We use a “mental stop” and have our online broker message us if the price comes back to the entry point and then decide whether to give it a little more room.
Or you can use a hard stop-loss order with your limit order (using an OCO or one cancels the other order) for your target sell price if you are at work and can’t respond to text messages.
Getting back to our above example: with stocks that show a strong initial move like this and have strong fundamentals, we would keep up to half our position after it hits the final target listed and let the rest ride until the uptrend support has been broken with a closing price or another sell signal emerges discussed in our PowerInvesting ebook.

As can be seen on the chart above, the stock closes below our original uptrend support in late June. However, you will notice that a new higher trajectory uptrend has developed since our entry in March. The stock breaks this uptrend at a much higher price after we reported a bearish reversal signal for the overall market in late May.
That was the time to sell the rest of our position at around $58. The stock quickly reclaimed its uptrend support but later waivered and closed below it again which is typical behavior once the uptrend has been broken the first time.
If the fundamentals remain strong, the stock will normally come back up and touch the uptrend support, at least briefly, but not always. If fundamentals weaken or the market is peaking or in a downtrend, its a clear cut signal to exit the trade.
Now if the stock closes below the uptrend support prior to reaching our target sell price, this is a clear sign that the uptrend has been broken. We then cancel our limit order for our target sell price and change it to a market order for the market open price the next day.
This occasionally results in a slight profit but normally at a price below our entry price. If another sell signal discussed in the PowerInvesting ebook emerges, at any time after entering the trade, we sell immediately.
- Practice trade without using real money until you are comfortable with any new system. If you start during a bull market and a correction or bear market develops, be sure to practice trade your first market downtrend as well.
- The best results generally occur when you focus on just a few ideal trading opportunities per month. The ones that have a company-specific, industry or market catalyst that day or the night before you enter a trade with price confirmation. Or have an upcoming catalyst in the days ahead as its reaching a good technical entry point.
- If a stock closes below its uptrend support before reaching its target entry, we generally take the stock off our radar and look for the next trading opportunity. The long-term uptrend has been broken. Sometimes we will give it another day or two to go back above the uptrend support. In this case we want to see this happen strongly and within a few days before considering a trade.
- We generally sell within a couple weeks prior to the earnings release. One possible exception is during a bull market when the stock has a tendency to beat earnings estimates by a wide margin. The earnings reporting date can usually be found on Yahoo Finance or the company website. We have a link to the Zacks expected reporting date on the subscription site.
- Check the risk-reward ratio at the point of entry. Occasionally, the price jumps much higher shortly after being featured in the Weekly Alert. The short-term downtrend may be broken at that point but the stock may be at a price where the risk-reward ratio is no longer appealing. If its a terrific opportunity, we sometimes will still trade it with a tight 4% stop. (In these cases, you can also wait to enter after the first pullback in the stock when the risk-reward ratio is favorable. Typically, this ratio is at least 1.5 to 1, meaning 1.5 times as much potential profit as potential loss with the trade.)
- Its critical to be consistent and have a stop-loss plan and limit order in place for your target sell price(s). Having a clear stop-loss plan and acting decisively on it helps to avoid major losses that tend to take longer to recover from.
- Never base your buy and/or sell decisions based solely on this or another site. Do your own due diligence. Watch lists are provided on the subscription site so you can put your favorite trading opportunities in a separate list after researching each one.
- Diversification is an important consideration. We generally diversify our trading capital among at least 3 stocks, often keeping a substantial amount in cash – especially during a market downtrend. Talk to your financial advisor about how much of your portfolio to put into individual stocks.
- We also use the other rules discussed in the PowerInvesting ebook.


