The bull flag pattern is probably the most bullish chart pattern you can trade. As the name suggests, it looks like a flag pole with a flag on the top portion of the pole.
To form the pattern, the price rises substantially in a short period of time and then consolidates for generally a few days to a few weeks to form the flag portion of the chart pattern.
A true bull flag pattern often leads to a secondary move of similar magnitude. The price often rises 15% to 50% or more in a short period of time IF the price breaks out of the top of the pattern.
A lot of traders use the bull flag pattern interchangeably with the term flag pattern. However, a bull flag (or high, tight flag as its sometimes called) is actually a very bullish subtype of the flag pattern.
In a bull flag pattern, there needs to be a 90% price rise or more within a couple months before the horizontal consolidation. Anything less than that and you have a less bullish flag pattern.
Here is an example:
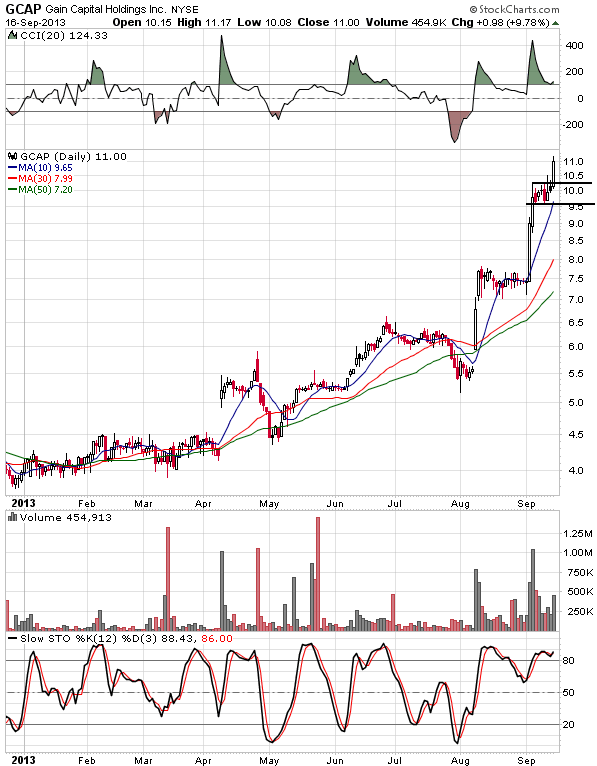
Bull Flag Pattern sent to customers before a nice 30% move within a couple weeks.
Bull flag patterns are generally much more bullish than simple flag patterns. Why? Because the stock has already proven that it can make a huge move in a short period of time.
Plain flag patterns are less reliable chart patterns and we definitely need a strong uptrend leading into the pattern to pique our interest. Both patterns tend to fail during market downtrends and after the market has generated a bearish market signal.
So we definitely tend to avoid these chart patterns during market corrections and bear markets.
We only focus on bull flag patterns where the fundamentals of the company are also trending much higher.
Strong earnings beats, strong trial results if its a biotech, a big increase in commodity prices if its a commodity-related stock in conjunction with a market uptrend are some examples of fundamentals trending much higher with the price.
The price of the stock often surges 15%, 30%, 50%, even 100% or more out of this pattern. They are pretty rare outside of penny stocks which tend to be less reliable.
If the flag portion of the pattern develops a consistent downtrend, its often called a bull pennant pattern because the flag has a triangular shape.
This pattern often develops because of a buy-out offer. Obviously, in nearly all cases a buyout will produce no secondary move worth mentioning.
So be sure you know why the stock has made the initial move higher into the flag portion of the pattern.
We want to see lighter volume during the consolidation and then a volume explosion as the price reaches the technical entry point. Volume should be stronger than what carried the price into the flag consolidation.
We generally want to see the stock consolidate for at least 3 days.
This entry point is a move above the downtrend resistance within the flag in the case of a bull pennant. And a move above the flag pole if the consolidation is rectangular shaped.
Ideally we want to see no overhead resistance with this pattern. If there are horizontal resistance levels above the flag, we use that to help determine an exit strategy before entering the trade.
In the case where there is no overhead resistance, one profit target is 50% of the move into the flag portion of the pattern projected from the low within the flag consolidation portion of the chart pattern. However, a bearish candlestick pattern on a daily chart was found to be a better exit signal in our back-testing.
We always use a hard stop-loss order with this type of trade. Generally it works out very well in favorable market conditions when it meets the rules in the high tight flag course, but you need to have a stop-loss slightly below the flag portion of the pattern.
We also make sure the risk/reward ratio makes sense in light of this before entering the trade. The risk/reward may make sense when you first spot the pattern but not when it breaks out so you need to calculate it again before entering the trade. Using a tighter stop is another way to make the reward/risk ratio make sense.
We normally find a few of these per year for clients during most market conditions. In most cases, the market is trending higher so you want to look for these if you are a momentum trader going after big gains.
The win rate is generally pretty good with a lot of upside potential on stocks in long-term uptrends above key moving averages with no overhead resistance. However, we have recently developed an optimized strategy of selecting just the best high tight flag breakouts at the point of entry.
Less than 25% of high tight flag breakouts will meet the criteria but waiting for the best ones yielded terrific results in the back-tests.
In fact, the win rate was nearly 90% while using a 4% stop using our New Filtered High Tight Flag Strategy.
Click here to learn more
