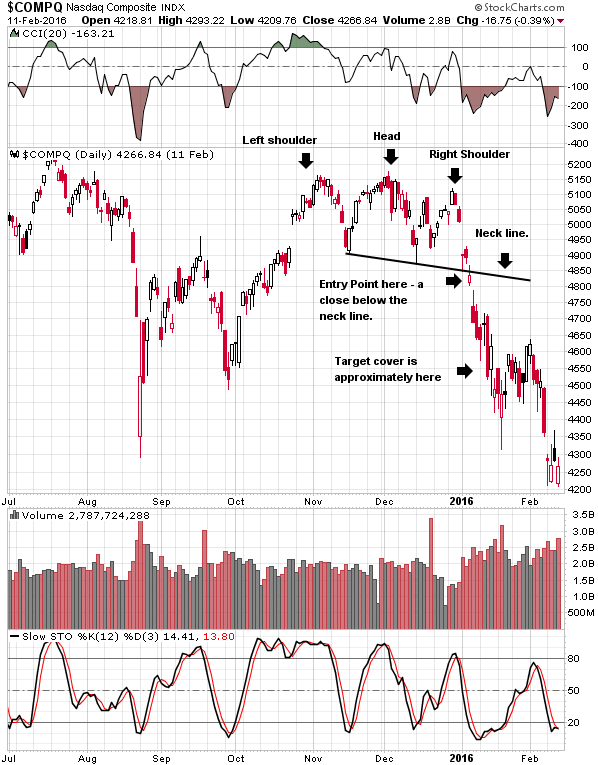
The head and shoulders chart pattern is a bearish pattern generated by stocks, etfs, market indices and other instruments.
Its one of the most well-known and feared chart patterns among traders and investors.
As the name suggests, the pattern looks like a head and 2 shoulders on a price chart. The price of the stock or other instrument first rallies and then rounds over to pull back to form the left shoulder.
Then a larger rally starts to form the head portion of the pattern. The price then rounds over to pull back again, stopping near the prior low generally.
A third rally then takes the price to a high point below the high of the prior rally before turning over again. This forms the right shoulder.
Ideally, the right shoulder is formed on lower volume.
The pattern is then confirmed by a move below the support level or “neck line” defined by drawing a line connecting the lows between the head and 2 shoulders of the pattern. Getting in prior to this point is not wise as it will lower your probability of success.
You want to see the neck line support taken out. Preferably on very strong volume before going short or buying put options.
The head and shoulders pattern is a special form of a classic trend change signal that all traders need to learn and memorize. Namely, an uptrend ends once you see a lower high on the same time frame that the prior highs and lows were made.
The trend reversal is then confirmed with a lower low. This is sometimes referred to as a 1-2-3 trend change by technicians. So the head and shoulders pattern is a special form of a bearish 1-2-3 trend change.
News, forecasts and hype may or may not carry the stock higher. But money talks. If the stock is not making higher highs and higher lows on a stock chart, there is a problem if you are long the stock or other equity. That is important to fully appreciate when swing trading or day trading.
This is because stocks are no different than other commodities. You need demand to overwhelm supply to move the price higher. Its true for a barrel of oil and its true for the price of a stock or index. This is why volume trends are important to analyze.
Here’s a great example of a bearish head and shoulders pattern on the Nasdaq index that helped us to forecast the move lower in the overall market in January of 2016. We saw the bearish market signal in early December but this pattern helped us to confirm the bearish signal.

Notice that the neck line is sloping downwards. This is the best case scenario if you are short (or worst case if you are long the index or QQQ.).
The target of the pattern is calculated by taking the distance from the top of the head to the neck line and projecting that from the neck line on the right side of the pattern. In this case it was about 4550 which was quickly reached in about a week.
Its probably best to cover a portion of your shares near a nearby support below the target if the trade gets off to a really good start on strong volume.
So you could have covered a portion just above the August lows in this case. It was pretty obvious we were going to test those lows as the pattern breakout unfolded.
Of course not all of these patterns work and you want to put a stop just above the right shoulder or a point just above a prior resistance. Or, you could exit the trade if it closes back above the neck line.
This is a fairly reliable pattern but the volume confirmation and reason behind the move is important to understand as well.
Get our Latest Market Analysis and top 2 Chart Patterns for the Weeks Ahead


