PowerInvesting Weekly Alert
December 24, 2011
Hello and welcome to this weeks edition of the PowerInvesting Weekly Alert! As always, you will find our current market analysis followed by the stocks we are currently watching carefully. We expect these stocks to explode with quick gains of 5-30% or more if and when they break their short-term downtrend.
Recent Performance:
Last weekend we featured a great stock for a challenging market. A company with rising estimates and a track record of beating those estimates. With a low PEG ratio of just .6 and a nearly 3% dividend to boot within a defensive industry. In a steady, sustainable uptrend. The stock was AEA – our top featured trading setup last weekend. And it easily beat the market last week. And still poised to move higher. Our other long trading setup beat the Naz as well.
Our short setup, WMS, got off to a strong start. When the market followed through and generated a bullish market signal on Tuesday we told everyone in the Daily Alert it was time to get out of all of your short positions. Just before the stock really started to move against us. Getting out of short positions after a bullish market signal is very important to avoid major losses when you bet against a stock.
One of the best trading setups we have seen all year was featured in the Daily Alert the week prior. This stock quickly moved more than 12% in our direction by Wednesday morning and is about 20% in the black for those who held on for the remainder of the week.
One of the most bullish price patterns we have seen in some time was featured in the Daily Alert on Tuesday. This stock has probably the best chart formation of all the top growth stocks that meet our strict fundamental criteria. Friday it surged higher once again and is up several percent since being featured in the Daily Alert on Tuesday. On its way to much larger gains in the weeks ahead.
Those new to our site and methodology should review our basic buy/sell rules. Click here to see them. And we offer a book that covers all of our stock picking and trading techniques in more detail. Click here to download a copy of our book that will show you how we find and manage the great trades featured in this newsletter.
Market Analysis:
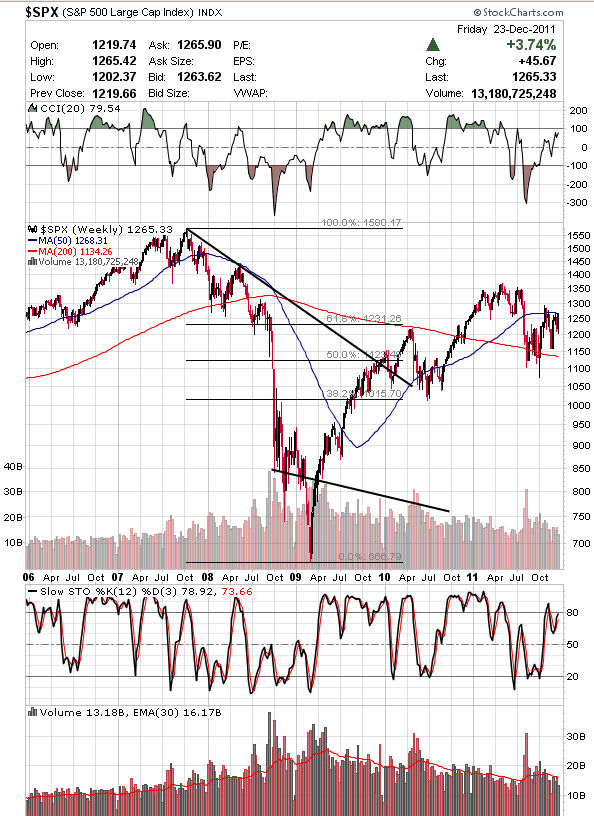
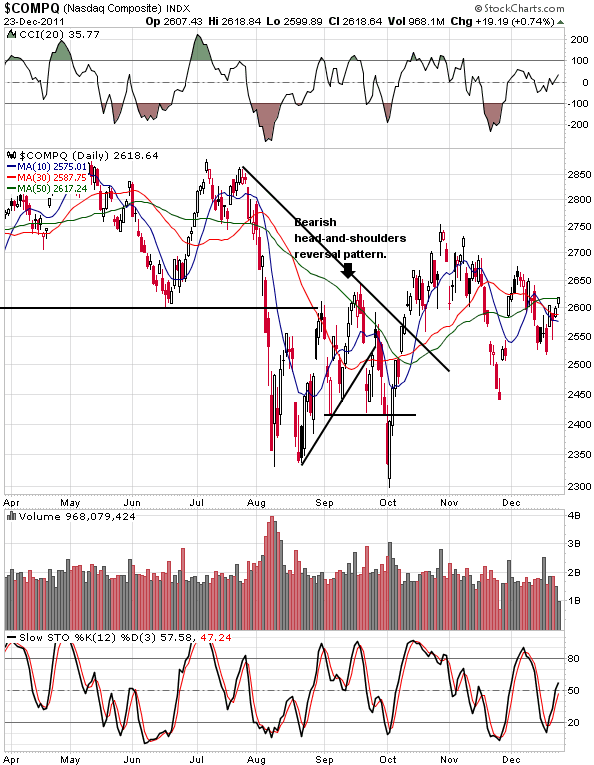
On Tuesday the market generated the technical event we have been waiting for. The Nasdaq vaulted more than 3% on stronger volume and the S&P 500 moved up around 3% as well. This qualifies as a bullish confirmation signal. The same signal that has occurred during the early stages of all bull markets over the past 50 years. So Tuesday was very significant from a technical perspective.
The bullish signal occurred 17 days after the rally attempt started in late November. You normally want to see the bullish confirmation occur 4 to 10 days after the start of the rally attempt. But some strong market uptrends are associated with bullish confirmations that have occurred more than 10 days after the rally attempt started. So there is a chance that this uptrend could run for some time.
Last weekend we mentioned that the uptrend in gold that has lasted a few years was being unexpectedly challenged. This week we got a bounce from the yellow metal. Although its still right above the uptrend support.
One concern we have is that one of the strongest chart patterns right now is consumer staples which broke strongly out to all-time highs this week. We want to see other non-defensive sectors lead the market higher. Although the retail index is nearing all-time highs. The long-term chart on the banking index looks pretty weak with some modest short-term strength. Banks have nearly always led the market higher in years past. The good news is that the Dow transportation index is looking strong here.
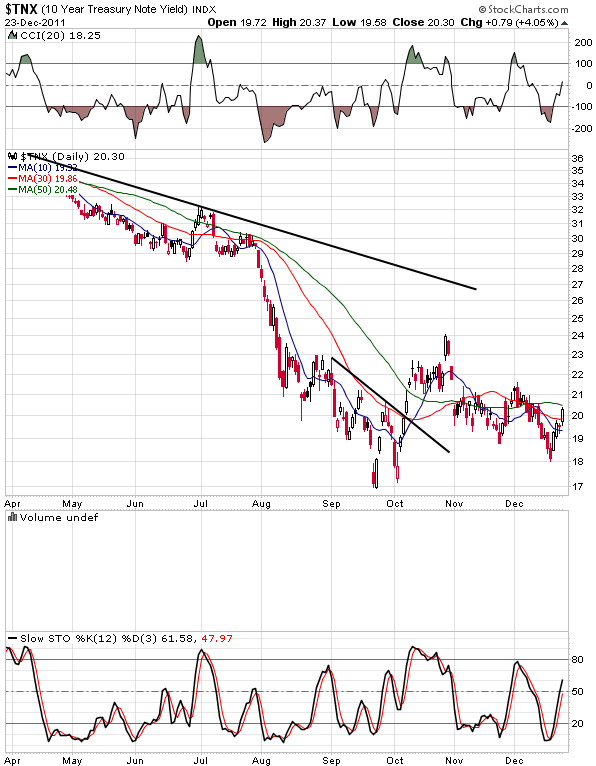
The yield on the ten-year treasury moved strongly higher last week. The yield was up nearly 10% and closed over 2%. The longer-term trend is still pointing to lower yields but this could change quickly.
* All charts below courtesy of Stockcharts.com.
S&P 500 Chart:
Nasdaq Chart:
$tnx Ten Year Note (interest rates):
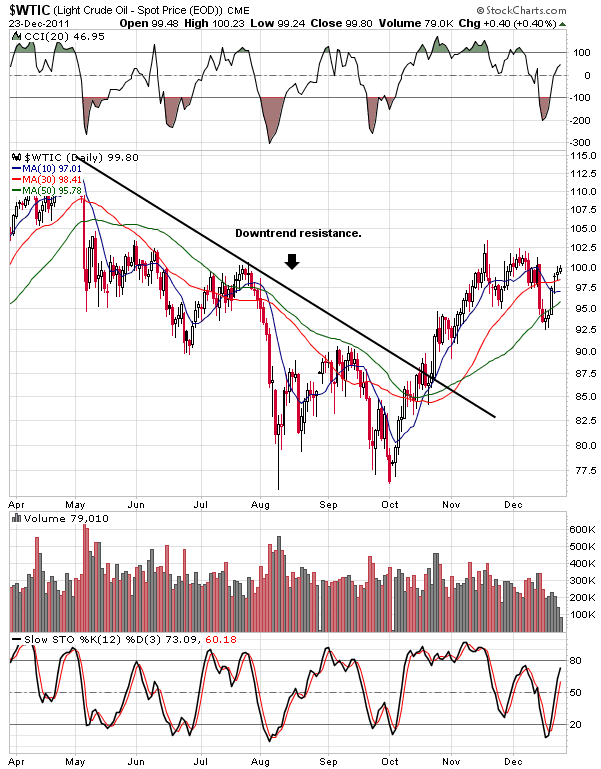
$wtic (Oil continuous contract):
This Weeks picks:
All of our picks are ranked in the top 5% of all stocks in terms of the following criteria at the time we publish the Weekly Alert.
1) Increasing future earnings expectations over the past few months.
2) Meeting and beating earnings expectations each quarter.
3) The reliability/track record of the analysts raising the earnings outlook.
Paid subscribers can click on the charts below from the members-only website to see a more recent chart each day. This chart has the stop-loss and target entry already drawn for you so you can quickly see if a target entry has been reached or a stop-loss point has been violated each day. Click here to subscribe and see which of our stocks are breaking out today!
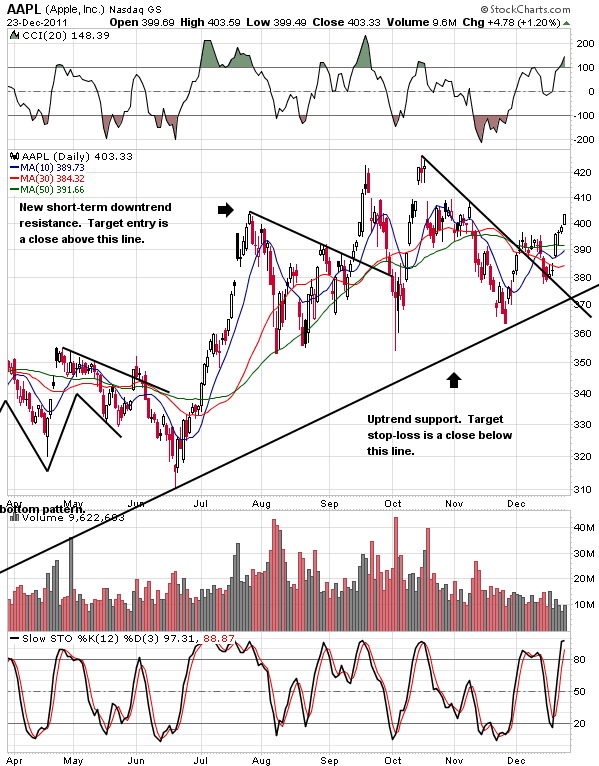
AAPL Chart:
(Long) AAPL – Apple Inc., together with subsidiaries, designs, manufactures, and markets mobile communication and media devices, personal computers, and portable digital music players; and sells related software, services, peripherals, networking solutions, and third-party digital content and applications worldwide. Apple remains the king of growth stocks. If you look at what matters: results. Earnings growth has averaged over 61% over the past five years. Sales growth has averaged 45% over the past 3 years. Return on equity is over 41%. And margins are very high for the industry. The company has nearly 26 billion in cash according to Yahoo Finance. Estimates have gone up over 5% over the past 90 days. The price is in a horizontal channel and has just broken a short-term downtrend. Our target entry is Monday morning with a target sell price of $516. Our stop-loss is a close below the uptrend support shown above. Click here for a free and quick primer on how to determine when our target entry and stop-loss has been reached on our swing trading setups.
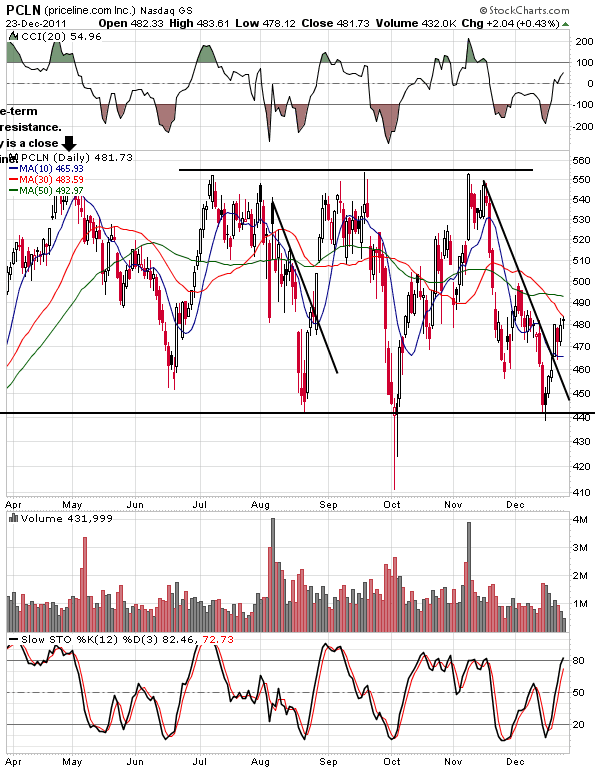
PCLN Chart:
(Long) PCLN – priceline.com Incorporated, together with its subsidiaries, operates as an online travel company. The company provides price-disclosed hotel reservation services on a worldwide basis primarily under the Booking.com, priceline.com, and Agoda brand names; and price-disclosed rental car reservation services in approximately 80 countries through TravelJigsaw brand name. Priceline.com is probably the #2 American growth stock with average earnings growth per year of over 57% and sales growth of 31% per year over the past 3 years. Return on equity is nearly 47% according to Yahoo Finance. And they have nearly 5 times as much cash as debt on the balance sheet. The PEG ratio is just .74. PCLN also recently broke a short-term downtrend but within a wide channel. Estimates for next year have gone up slightly over the past 90 days. The price has broken a short-term downtrend within the wide channel. Our target entry is Monday morning with a target sell price of $552. Our stop-loss is a close below $440.
FICO has formed another bull flag pattern and could break out to the upside in the days ahead. For the momentum traders out there. This stock was recently featured here (click ‘featured trading opportunities’ to see it in the list). Although an uptrend support was broken, it could still make a big move if and when it breaks out.
Brian C. Neall
Founder – TradeToBeFree.com
Email: info@tradetobefree.com
Web:www.tradetobefree.com
PS – If you would like to save money on your subscription, you can order an annual and lower your cost per month. If you ordered the PowerInvesting ebook, you can save another $39 off the total cost by sending us a quick email after ordering. Just enter the source code found in the book when ordering to receive your $39 discount. Click here to order.
Disclaimer:
Tradetobefree.com, Tradetobefree.com, LLC, its founder and members of its organization are not a financial advisor or broker and we do not offer financial advice based on your personal financial situation or goals. None of the information contained in the Weekly Alert, web site or other materials constitutes a recommendation to buy or sell a particular security. As consideration for your being provided access to information provided by TradetoBeFree.com, LLC , (the “Company”) you agree that the Company and Mr. Neall shall not be held liable for any investment losses you may incur by using the information including your trading the stocks mentioned in the Weekly Alert or other Company publications.The content provided by the Company is provided solely as an informational aide to your investment research and all investment decisions are solely the responsibility of the user. The information contained in the Weekly Alert, Tradetobefree.com website and other materials offered by Tradetobefree.com, LLC is believed to be accurate; however, we make no warranties or guarantees to its accuracy.
STOCK TRADING AND OPTIONS TRADING INVOLVES HIGH RISKS AND YOU CAN LOSE ALL OF YOUR MONEY. Being a successful paper trader during one time period does not mean that you will make money when you actually invest during a later time period. Market conditions constantly change. When investing in securities or options you may lose all of the money you invested. Stock trading and investing involves risk of loss to investment capital and past performance is not a guarantee of future results. See policies.
Copyright © 2004, 2005, 2006, 2007, 2008, 2009, 2010, 2011, 2012 by TradeToBeFree.com, LLC – All rights reserved. (However, feel free to forward 1 copy to friends and relatives!)


