How to Swing Trade Earnings – The Earnings Flag (2024 Update)
Early to mid August is one of our favorite times to play big earnings flags.
During and after each earnings season, a lot of great earnings flags set up on stocks with the most impressive results and raised outlooks in their earnings reports. As the market gathers some strength, we are seeing some big ones set up already in the alert service this summer.
Also, a lot of great young growth stocks will be reporting and forming bullish earnings flags in early August. So now is the time to get ready.
In the fifth video in our free swing trading course below we talk about trading earnings and our top 2 strategies to make money around the time a company delivers an enormous earnings beat.
One of the favorite strategies to play big earnings beats by top swing traders is through trading earnings flags. We find these throughout the year for clients. CRDO is an example of a great earnings flag featured last quarter. It was also a high tight flag which is even better.
After a huge earnings beat and raise, a bullish earnings flag chart pattern often develops. Especially if the earnings beat and raise meets all the criteria in the earnings eruption videos and has a strong, clean initial breakout.
A good example of this is DUOL discussed in our last blog post titled “Should You Buy an IPO?“.
Why Use Technical Analysis after Earnings
Talk and opinion on stocks abound online, but the big money speaks louder than words. You can follow the big money using technical analysis to identify the strength of the long-term trend and earnings flag consolidation.
The earnings flag is one of the best swing trading setups in bull markets. The earnings eruptions strategy is often more of a day trade (sometimes the trade is held for a few days or more) but an earnings flag is a trade that is normally held for a few days or longer.
That being said, the best opportunities in our opinion are the big earnings gaps on the best stocks right after a big beat and raise quarter. The long-term trend needs to be bullish, the gap needs to be tall enough and the price needs to reach the technical entry point.
Also, the earnings beat, sales beat, margins and guidance raise need to be large enough to meet the rules in the earnings eruptions strategy.
Without knowing these rules, we would stay away from jumping in right after earnings and focus on earnings flags.
We say this because the earnings flag generally has much less volatility around the entry point. With hundreds of earnings reports coming out each day during earnings season, many large investors will sift through the reports and other information and begin to take large positions days or weeks later after the volatility settles down after earnings.
We find and trade earnings flags in our own trading and identify great ones for clients subscribed to the weekly and daily alert.
What is an Earnings Flags vs a Pennant?
The earnings flag is a sideways or sideways to lower consolidation after a big move higher right after the earnings release. The move higher after earnings may last a day up to several days or more. Usually, the big initial move higher right after the earnings report is over within a 3 to 5 days.
Then the price generally either starts to move sideways or make lower lows on a daily candlestick chart. A “pennant pattern” occurs when a consistent downward slope to the pullback develops with another trend-line connecting the lows in the consolidation.
If we draw a line connecting the highs and the lows in the consolidation, the tend-lines will converge at some point in the future. This creates the pennant or triangular shape in the flag portion (consolidation portion) of the pattern. If the 2 lines are roughly parallel, the consolidation is a flag but not a pennant.
Ideally, I want to see the flag portion of the pattern last four weeks or longer after a large move higher right after earnings. These tend to lead to larger moves. The consolidations that only last a few days tend to lead to smaller moves higher. (An exception to this is the high tight flag when it meets the rules in our high tight flag strategy if and when it reaches the entry point.)
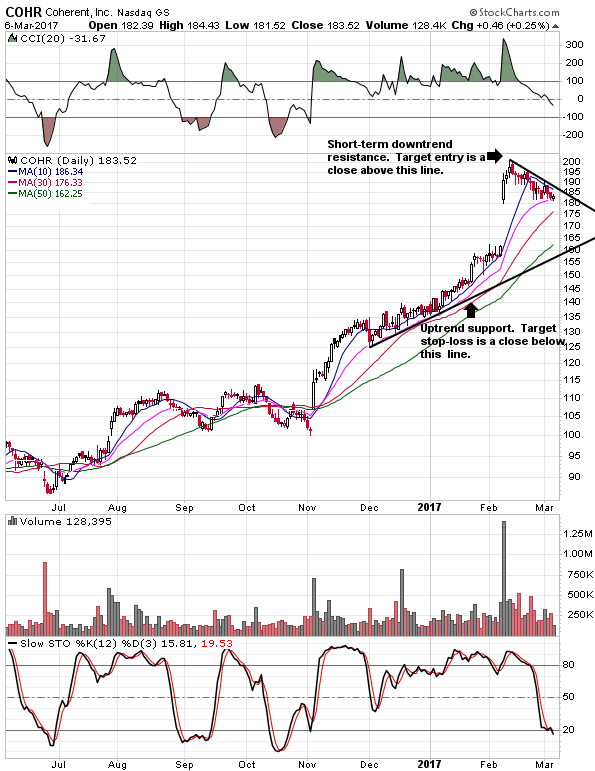
In a pennant, we should be able to draw a line connecting the highs and lows in the consolidation and have several touches or near touches of this line as in the example below on COHR – a great earnings flag we featured to customers (note: the line connecting the lows in the flag is not drawn in the chart below).

Swing Trading Earnings Flags – Entry & Exit Points
After this swing trading setup is featured on the site you would just click the chart each day. When you click the chart the latest chart comes up with the downtrend resistance line already drawn for you.
You can see when the entry signal is reached with a quick glance each day on the subscription site just by clicking the chart.
The entry signal occurs once the price closes above the short-term downtrend resistance. After the price closes above it, we put a market order to buy for the open the next day.
Or, you can put a text alert with your broker to notify you if the price goes above the prior days high the next day for further price direction confirmation and higher win rate while giving up some of the potential upside.
This makes it very easy to play this setup whether you work full time or not. You would be surprised how often you get a good entry price just by buying the stock at the open the next day with a market order placed after hours. Again, you are often in the trade for multiple weeks using this strategy out of the longer consolidations.
Then once the order fills you can put a stop about .5% below the prior swing low on a daily chart. So, in the case of COHR below, the prior swing low once the price reached the entry point was about $180. A good hard stop would be a little below that level.
Or, if there is a confirmed uptrend support, as in the case of COHR, you could just cut losses if it closes below the uptrend support if it goes the other way as shown in the chart above.
Earnings Flags on Lower Priced Stocks
We definitely avoid this pattern with penny stocks or nearly all stocks under $10 unless the stock has developed a long-term uptrend with strong fundamental improvement. Stocks under $20 tend to have a lower win rate as well.
These lower priced stocks too often collapse suddenly which lowers the win rate and average profits while increasing risk during most market conditions. Its also difficult to focus on work and other matters knowing lower priced stocks can drop 20% or more suddenly.
That being said, a few of these lower priced stocks will have strong growth, will beat earnings estimates and have rising estimates. So we want to focus on these names when looking at lower priced stocks.
Profiting 20% on half your trades and losing 20% on your other half would take you down a path to losing a lot of money as explained in this blog post. So we get very picky when trading stocks under $20.
Earnings Flags that are not Pennants
If the stock makes the big move after earnings for a few days, then consolidates sideways rather than sideways to lower in a pennant, the entry point is a move above the high in the flag.
Its best if the stock is breaking into all-time highs to reduce overhead resistance. With stocks below highs, some traders and investors will want to get out near breakeven if the price was at that level within the past year or longer. Its only human nature.
You also have to consider valuation at that point. Ideally, we want to see a stock with very strong, consistent growth in sales and earnings followed by a recent acceleration in growth.
Or, we are looking for a stock that crushed earnings expectations, raised guidance significantly and is still reasonably valued. In both cases, its best to have a new catalyst such as a significant price target raise from a well known, respected analyst.
Profiting on Earnings Flags
Once we are up 4% to 10% you can sell some of your shares and put in a stop loss around your entry point. You could also just sell the whole thing on the initial move higher out of the flag which usually occurs within a few days.
The video below shows examples of stocks that have recently reached their first profit zone where we can take some profits and tighten our stop to ensure a profit.
We like to find the nearest support on a 10 minute chart below our entry and place the stop a few cents below that point when we raise our stop after taking some profits. As always, its critical to get in near the ideal technical entry point.
As the old saying goes – “You chase, you lose”. I find that to be true in general. The one exception is if the price goes through the technical entry point on massive volume with a very big move that day.
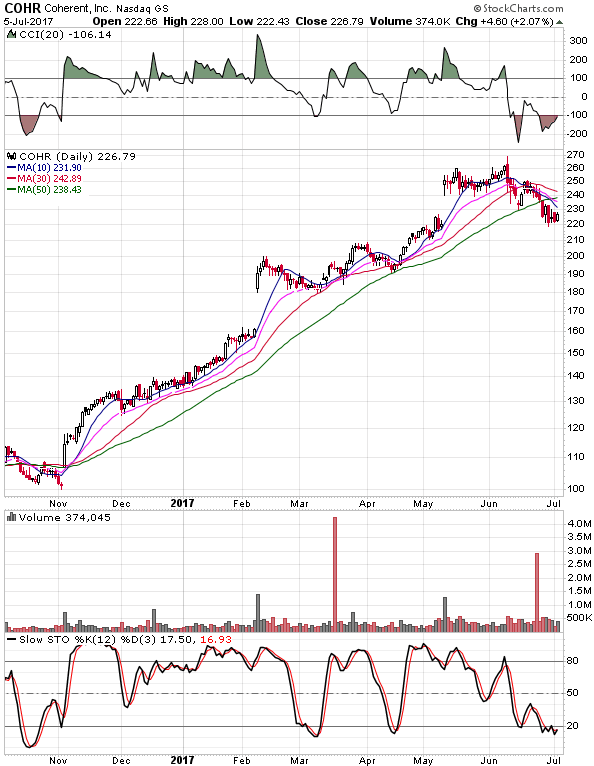
In the case of COHR, we had a real nice more horizontal consolidation rather than a sharp descent in the flag. And we had a real nice fibonacci retracement of the move from around $140 to $200. Projecting this from the low in the flag, $180, would give you a target of nearly $240 which is a 33% profit.
In the more recent chart below we can see that COHR easily reached this more aggressive target several weeks later. The advantage of trading stocks with rapidly improving fundamentals is that you can get big moves over a long period of time like this while you do other things and spend a lot less time trading.

The video above goes over how we trade earnings flags in more detail. Other swing trading beginner course videos can be found on the blog.
In Summary
By using technical analysis, we can enter at a point very near a firm support as its breaking out of a flag in this case – setting up a great risk/reward ratio. This is one of several very bullish technical patterns explained more on the site.
Earnings flags are a favorite of top traders and a great swing trading strategy. We should see a lot of these come up in the weeks ahead which they often do towards the mid to later portion of earnings season.
Top Echelon Earnings Eruptions Patterns are Working this Quarter Again – Start Learning on Blog
My List of Stocks with Rapidly Improving Fundamentals Poised to Move This Week


