Making Money on the High, Tight Flag Pattern
The bull flag or high, tight flag pattern is arguably the most bullish chart pattern. This pattern often leads to some of the largest gains of the year in the market.
The biggest winners during a given year often break out of a high, tight flag early in their run.
In 2018 we saw ticker I, IQ, TLRY and many others move 50% to over 500% after breaking out of a high, tight flag. Within a few months. And sometimes the move happens in just a few weeks. Again, after breaking out of a high, tight flag.
Most stocks that make a 90% move higher turn over quickly. And its usually very difficult to predict which ones will make that kind of move. However, if a stock moves 90%+ higher, then forms a narrow consolidation (so we know its not just another pump and dump) and then breaks out with a lot of volume, the chances of a big move from the breakout point is actually much higher.
That is probably the single most important concept to understand in this article and one of the most important to understand if you want to momentum trade and play the hottest stocks in the market.
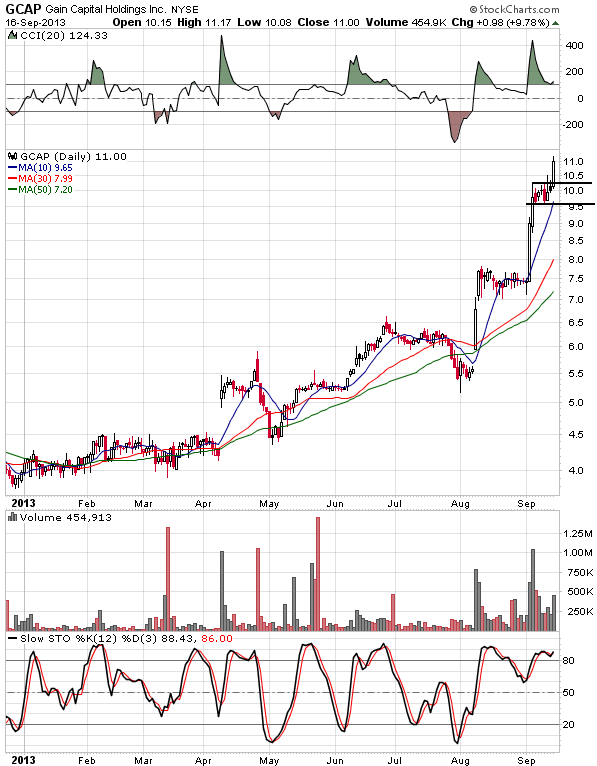
On a chart the high, tight flag pattern looks like a flag pole with a flag or pennant on top and pointing to the right-side of the chart. Its pretty easy to spot once you see it the first time. Here is an example from the September 16th issue of our Weekly Alert newsletter.
The horizontal lines shown in the chart above mark the support and resistance in the flag portion of the pattern. The flag portion of the pattern should have low volatility as it does in this case. And the rise into the flag needs to be very strong.
A 20%, 40% or even 80% move into the flag within a couple of months is NOT enough to qualify as a bull flag pattern as we are using the term here. The initial move before forming the flag needs to be larger than that.
The entry point is a break above the top of the flag or a close above a confirmed short-term downtrend resistance if the flag is shaped more like a pennant.
This was our top trading setup that week in our newsletter. It quickly surged about 30% higher within just 2 weeks after we featured it. These gains are unusual in that time-frame for most stocks.
However, its not unusual out of this pattern. We find this especially true for stocks with rising estimates that tend to beat those estimates and stocks with very strong, consistent earnings and sales growth. The type of stocks we trade and feature in our alerts.
Some of our most exciting and profitable trades came from stocks with rapidly improving fundamentals breaking out of a bull flag pattern. And this time of year they begin to show up on our radar more and more. Although a little rare on quality stocks, from late August through June you will find more of these very powerful setups.
A safer target for this pattern is a 50% projection of the initial move into the flag over the past couple months. Projected from the bottom of the flag portion of the pattern.
Traders often use a stop-loss anywhere from 1.5% to 5% below the breakout point for a great risk/reward trade. Others put a stop a little below the low in the flag portion of the pattern to use a wide stop-loss but with a higher win rate. Recent IPOs tend to have a lower win rate as explained further in other blog articles we have on the high, tight flag. Except the ones that meet all the rules in the high, tight flag course at the breakout point.
On a momentum trading pattern like this we almost always put in an OCO order with our online broker. Which is a limit order for our target sell price and a stop-loss just below the breakout point or bottom of the flag portion of the pattern wrapped up into one order.
Make sure you find all of the quality bull flags available in the current market so you will not miss out during the “high season” for these monster trading setups. Just be sure the underlying fundamentals are rapidly improving to justify the higher prices. You will be very glad you put these on your radar.


do you have monthly trial on investtobefree.com?
The performance over the first 7 years has been tremendous and we do not offer a monthly rate at this point. However, we have a popular annual subscription and offer a quarterly option from time to time.