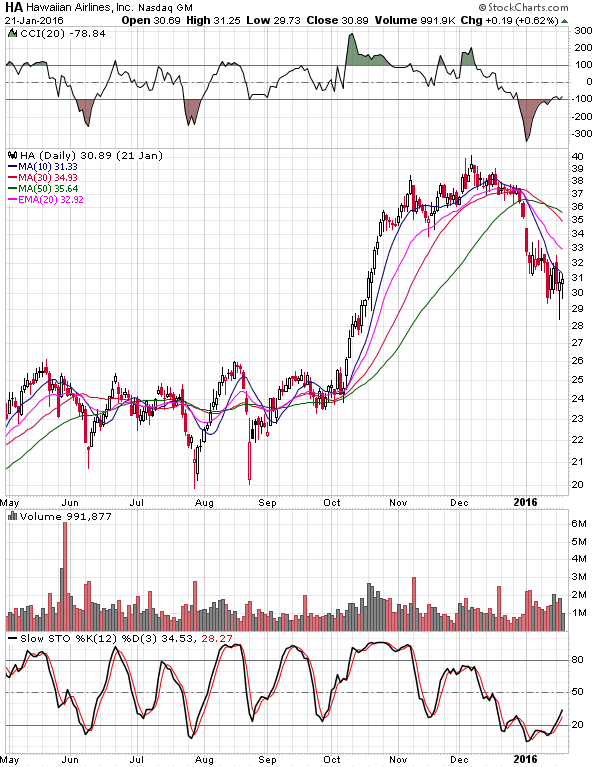
The Inverted J pattern (also knows as the inverted ascending scallop) is another very bullish chart pattern we often feature in our newsletter and trade in our own accounts.
Imagine taking the letter J and flipping it upside down and then turning it over across its vertical axis like a page in a book.
We look for these on a daily chart on only the top growth stocks and companies soundly beating estimates with rising future expectations.
Its important to have a strong initial move followed by a rounding shape to the top of the pattern as in the example below. The pattern should take a few months or less to generate.
The taller (percentage of the price move) and narrower the pattern, the better. But it should take at least a couple weeks to develop.
If you can find one that occurs within a consistent uptrend, all the better. A consistent uptrend defined by drawing a line connecting the lows over the past several months.
Here is a great example from a trading setup found in early 2016 for our customers of our newsletter and our own account:

Inverted J pattern featured in newsletter prior to soaring nearly 50% higher. Click the chart to see how it performed since.
Our entry is a close above the short-term downtrend formed on the right-side of the pattern. This normally corresponds with a higher low.
In this case, this was just prior to the earnings release. So a safer entry point was an entry above the short-term downtrend resistance or horizontal consolidation normally formed after a good earnings report.
But in either case, we look to enter once the stock makes a higher low on the right side of the chart pattern. Another good entry point is a close above the highs of the pattern.
A breaking of the short-term downtrend after confirming or re-confirming the uptrend support is a better sign but not required for us to be interested in the trade.
As with most bullish patterns, you want to see the stock making higher highs and higher lows in an industry where other top stocks are making higher highs and higher lows over at least the past few months.
A good target is taking the move from the lows on the left side of the base to the high and then projecting that from the lows on the right side of the base. Perhaps selling a portion of your shares near the highs of the chart pattern if you purchase below the highs.
In this case, the stock moved about 50% higher from the entry point within a few weeks.
The keys to success were identifying the chart pattern, the strength of the industry despite market weakness, the company beating estimates with rising future expectations, reasonable valuation, and the strong long-term uptrend of the stock. HA also broke out of a large cup with handle pattern prior to forming this inverted J pattern which was another good sign.
This is a momentum trading pattern so you generally want to put a hard stop below the prior low on the right side of the base.
As always, we want to see strong, increasing volume near the entry point.
We look for these patterns all the time for our own trading and our customers only on stocks with the right near-term fundamental factors proven to beat the market by themselves.
Subscribe to our Youtube channel and see our free videos on chart patterns when released!


