Silicon Valley Bank and Short-term Swing Trading
Last week we watched one of the biggest point drops for a stock intraday this year. On Thursday, SIVB dropped 60% for the day. Despite this, some long technical short-term swing trading strategies have done well over the past couple weeks.
On Friday morning, shares of Silicon Valley Bank were halted pre-market and the bank was taken over by regulators after no buyers stepped in. Experts are saying that large depositors will likely be made whole eventually but it could be a long time before they have access to that money.
In the alert service, we talked about how we did some hedging with an inverse etf and may buy another hedge on the Russell 2000 which was greatly impacted by regional bank shares plummeting. The hedge is off to a great start for those who took on the trade as the Russell 2000 dropped 2.88% on Friday.
Meanwhile, FSLR is holding up well after we took much of the position off after a great move within a week after a great earnings report. Exiting a trade on significant negative news is one of the rules in our strategies.
The Advantages of Short-term Swing Trading
This is the advantage of short-term swing trading with a catalyst. You often get off to a nice start and can get back into cash quickly in a bear market when significant negative news hits the market suddenly as it did on Thursday and Friday.
These big negative news catalysts occur more often in a bear market with the Nasdaq and S&P 500 this far off the highs. As we have been saying to subscribers over the past year or so, its a time to manage risk tightly, take only the best trades with a new reason for the stock to go higher or lower, and raise a lot of cash. Sometimes the best long trade is cash.
Like we were saying last week, a lot of those who filled out our surveys have asked for more blog posts on what is working for us in any given market. Today we will talk about a strategy that has been doing surprisingly well in the current environment.
The High Tight Flag in a Bear Market
Traders online will tell you that the time to make the big money in the market is during market uptrends. This is true and we would like to see the market making higher swing lows and higher swing highs with declining volatility. After what happened late last week, this is no longer the case.
A market bottoming process, if that is what we are in, is fraught with sudden sentiment shifts and choppy up and down moves in the market. When the market is suddenly trending sharply lower, most all long strategies will lose money.
However, when conditions are ripe on stocks that form the best high, tight flags, its one of the best shots to make money long for us if the flag meets all the rules in forming the bull flag and meets the rules in the high, tight flag course if and when it reaches the entry trigger.
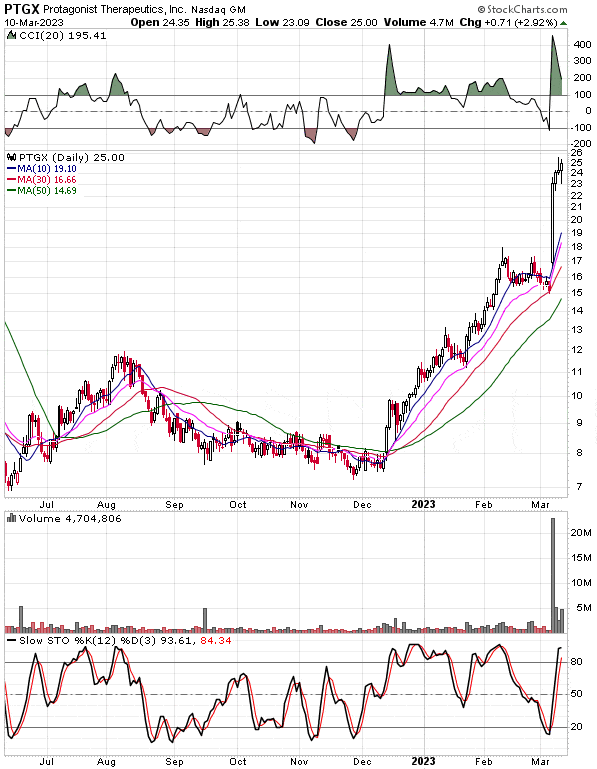
High Tight Flag Example
PTGX is a good example of this last week where it met the rules in the course, reached the entry trigger, and moved nearly 15% higher within 3 trading days in the face of the market turmoil. In a volatile market like this, we take more off near the first profit target taught in the course and stop the remainder at around breakeven.
If the high tight flag does not meet all the course rules, in general we avoid it. Not very many stocks are in a high, tight flag to begin with using our strict rules for identifying them. Of those, only about 20% will meet the rules in the course when they break out. If they break out which is a very big if in a bear market.
Of the few we trade that meet all the course rules at the point of entry, we trade them more conservatively and tighten the stop on the remainder quickly in a bear market.
Charts courtesy of StockCharts.com
In this case, we took PTGX all off near the first profit target in light of the current market conditions explained more in the course. Its a good thing because it looks like the company had about $13 million in Silicon Valley Bank according to this Forbes article after the Friday close.
This is a new negative catalyst that would cause us to exit the trade with any price direction confirmation if we were still in it.
$13 million is a small fraction of its overall cash levels but just the headline alone could drive the stock lower early next week given the market conditions and sentiment in bank stocks. Again, the advantage of swing trading is that we get in and back into cash quickly before something else breaks as the Fed raises rates and the economy slows later as a result.
Picking off a select few high tight flag breakouts is all we are looking for with this strategy in a bear market.
A Big Advantage to Using the High Tight Flag Strategy
One of the big advantages of our high tight flag strategy is that the trade is over within an average of 3 to 4 trading days whether its a winner or loser. A real advantage over buy and hold strategies where you hold on and hope for a rebound as the stock fades away lower in a bear market.
Less time in the trade equals less time the trading capital is at risk to sudden market turns like we saw last week.
Some traders online say to keep it until it closes below a key moving average. However, during volatile markets, the exit strategy taught in the course tends to work better in our back-testing and our own experience.
A bearish candlestick pattern on a daily chart can also be a good exit signal but, again, things can turn quickly in a bear market. PTGX, or any high tight flag breakout, could drop very quickly.
This is why we make sure we get in at the ideal entry point with a very tight stop and take more profits at the first target profit range. Valuations may look good but that changes quickly if the economy goes into a recession.
Typical High Tight Flag Exit Strategy
Keeping the trade until it closes below a key moving average such as the 9 or 20 EMA works better during market uptrends and stocks near 52-week highs with little overhead resistance. However, even those we would trade with a tight stop in these market conditions when using these type of extreme momentum technical trading strategies.
But without going short, which we would rather not do, the best earnings breakouts, high tight flags and other strong patterns on a daily chart (on stocks with a BIG catalyst in multi-year uptrends above $20) are the best strategies for us in these market conditions.
Its best for us when these are traded with a tight stop-loss and only if the price reaches the ideal technical entry point with a catalyst (significantly better than expected). This usually helps to drive sentiment and the price higher. We also want to see price direction confirmation the next trading session.
So we are looking for stocks with a great long-term trend, a very good consolidation pattern and strong bullish news as the price reaches a good technical entry point.
As far as we are concerned, this is not a market to wing it but a market to study hundreds or thousands of these patterns in difficult market conditions and come up with a trading plan that works well historically at least. Newbies without a good trading plan and discipline will more easily suffer significant losses in this market environment.
Key Rule for Bear Markets/Corrections
In a bear market we take profits in that first 5% to 15% range and tighten the stop quickly. If the market averages are making lower swing highs and lower swing lows on news, its time to manage risk very well.
We can expect a lower win rate in this environment overall and we want fresh new news that should drive the stock price higher. We also want to trade less and focus on just the best ones that come up on our radar. A great swing trading pattern on a stock with rising estimates with a very reasonable valuation is a judgement call.
Getting in ahead of the entry trigger with no new news just has not been working over the past year or so. Trading ahead of a catalyst can work if the catalyst is better than expected. Its the better than expected part and raised outlook that is key which is why we look for those much better than expected catalysts generally after its released and we know the details.
There is an ideal technical entry point and a small window of time to get in as we just saw with the FSLR trade talked about in the prior post.
The IPO nostalgia trade may be over for now with the Silicon Valley Bank failure. The bank failure increases the chances of a more than modest recession and many recent IPOs may have money in now frozen accounts. Time will tell if IPOs that went public a couple years ago will still hold up and act well out of good technical patterns as they did earlier this year.
Shakeout or Start of Next Leg Lower?
So next week should be pivotal with a pre-planned Fed meeting on Monday, the CPI inflation numbers on Tuesday morning and PPI on Wednesday morning.
A close below 3750 on the S&P 500 with accelerating volume would be a bad sign. Some experts are predicting a move to 3000 or 3300 sometime for the S&P 500 in the first half of the year as earnings estimates come down much further.
A close below 3750, a rebound to one of the major moving averages, and then a bearish candlestick pattern off that level will be an interesting entry point for put options or another type of hedge for the following few months. This seemed to work well in 2008 and 2002 before big drops in the market indices that took some time to play out in many cases. We are studying the price action in 2002 in particular.
Of course, this could be a final shakeout in a new bull market as well. Perhaps Silicon Valley Bank will get a buyer shortly or the Fed creates a backstop to support other financials with direct exposure to Silicon Valley Bank, the contagion will prove to be minor, and inflation will fall again and the Fed will exit the center stage with the economy weaker but generally OK or a mild recession like we saw in 2001.
We will stay nimble and be ready to trade in either direction in case the bulls or bears clearly take over in the weeks ahead.
Spotting the Next Market Trend Change Signal

